A student taking a large course load next semester wants to know how much work will be involved with the classes she tentatively has mapped out.
Another wonders if other students have found a certain course helpful for the major he intends to pursue.
This week as students on the University of Michigan campus begin backpacking—the process of developing a plan for courses in advance of registration—a new tool, called Course Profile, can give them reliable data about their courses.
The Digital Innovation Greenhouse within the Office of Digital Education & Innovation rolled out ART 2.0, with the Course Profile name, on March 23 for students in nearly all of the schools and colleges that have undergraduate courses.
Finding out this kind of information in the past has been dependent on getting subjective information word-of-mouth from a peer, or through online sources that allow students to rate courses and professors but are not considered accurate.
“What we’re trying to do is increase the visibility of useful data that already exists,” said ART 2.0 creator August “Gus” Evrard professor of physics. “Accuracy is important and, our aim is to provide data you can understand and trust.”
The Academic Reporting Toolkit 2.0 is an expansion of U-M’s oldest learning analytics tool that in its first version offered faculty rich data about course enrollment, mean grade and grade distributions, enrollment in other classes, grade correlations among classes, and the impact of standardized test scores (AP/SAT) on course performance.
This iteration uses the same data through a tailor-made interface that informs student decision-making.
 “The Digital Innovation Greenhouse builds tools that personalize education using data. DIG’s ECoach and GradeCraft tools are already supporting students in a number of classes. This launch of ART 2.0 presents our first tool aimed directly at students,” said Timothy McKay, DIG principal investigator, Arthur F. Thurnau Professor of Physics and director of the LSA Honors Program.
“It provides everyone on campus with an array of new information about courses: who takes them, when, what they go on to major in, and what other courses these students take before and after this. It’s our hope that students will use this information to choose courses which are right for them—to personalize their own education.”
The Academic Reporting Toolkit was designed by the LSA Information Technology Advisory Committee, led by Evrard. It launched within LSA in 2006 and was expanded to including Michigan Engineering two years later. Since then, ART has helped thousands of faculty members address tens of thousands of queries.
Shortly after the Digital Innovation Greenhouse was created in 2014, ART 1.0 (more precisely the vision for ART 2.0), ECoach and Student Explorer, were identified as three programs that could be scaled to become valuable tools for faculty, staff and students across U-M. Collectively, the programs received a Third Century Initiative $1.4 million transformation grant as programs that promised to personalize the educational experience.
Evrard said ART 2.0 is course-centric at present, but the visual, paint-by-numbers approach used by the Course Profile service can also profile other aspects of the university experience, such as majors, instructors and extramural activities. He and the ART team have begun working with campus student groups, advising offices and faculty leaders on extensions, and these conversations will expand in the next academic year.
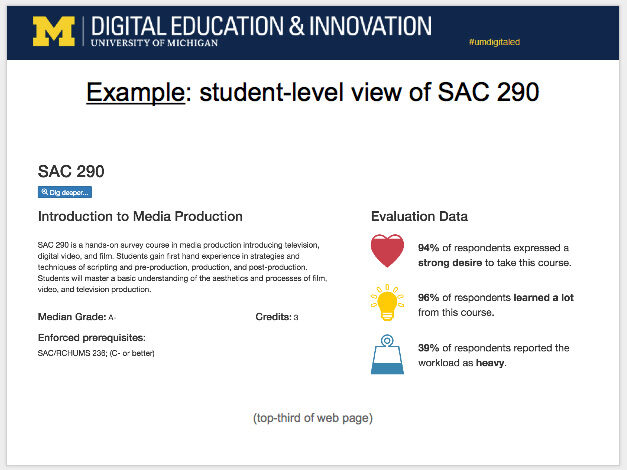
An at-a-glance synopsis of each of the approximately 9,000 courses available in the database offers a course description, a percentage of students who expressed a strong desire to take it, a calculation of how many said they “learned a lot,” and a percentage representing how heavy the workload was perceived to be by previous course participants.
Bryce Beckwith, an undergraduate information student, helped the development team by facilitating weekly conversations with Central Student Government, as the organization’s representative from the School of Information. She said students who already are aware of the tool are excited about its implementation.
“Information regarding courses and course selection is invaluable from the student perspective. A huge part of ART 2.0’s attraction is being able to see select responses from course evaluations data,” Beckwith said, adding it may encourage students to participate more evaluations.
“Students have always wanted to see this information and, in giving them what they want, we hope that students will continue to use this tool semester over semester.”
DIG Lead Developer Chris Teplovs said student participation through focus groups, a design jam and a small pilot was key to developing ART 2.0.
“A lot of students said it was amazing and very helpful. They also came up with other things they wanted,” Teplovs said. “Our mission is to help students be successful, so in creating features of the program we asked, what are the different dimensions of success, such as preparation for grad school?” The students were very helping in defining these, he said.
DEI also hired several student fellows from Stamps School of Art & Design, College of Engineering, the School of Education and the School of Information to work on various pieces of the project.
Teplovs and Evrard said the program will continue to evolve as they find more ways to share data students, faculty and staff can use.


